How to Choose Juniper QFX Series Network Switches in 2026?
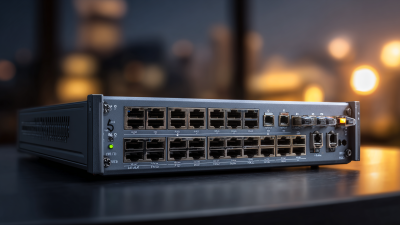
Choosing a data-center switch in 2026 requires more than comparing port counts and list prices. The Juniper Qfx Series Network portfolio spans compact campus models, high-density aggregation switches, and platforms built for demanding data-center fabrics. Each option changes uplink capacity, latency, power usage, automation, and future expansion.
Industry evidence supports careful evaluation. IDC’s Worldwide Ethernet Switch Tracker continues to show strong demand for data-center Ethernet, driven by cloud workloads, artificial intelligence, and higher east-west traffic. Dell’Oro Group’s Data Center IT Capex research also identifies accelerated infrastructure investment around AI clusters and advanced networking. These trends make 100GbE, 400GbE, telemetry, and efficient cooling important selection factors. However, market growth does not automatically justify the most expensive chassis.
Look closely.
A practical assessment should begin with traffic forecasts, rack density, optics availability, and maintenance skills. Juniper’s official QFX data sheets and Junos documentation can verify interface speeds, buffer design, EVPN-VXLAN support, automation features, and power requirements. Gartner’s research on data-center networking further emphasizes operational simplicity, resilience, and lifecycle management rather than raw throughput alone. Independent testing remains valuable, because vendor specifications rarely reproduce a busy production fabric.
There is room for doubt. A switch that appears ideal on paper may consume too much power, require costly transceivers, or exceed a team’s operational experience. Buyers should model three to five years of growth, not just today’s ports. This guide examines how to match QFX architecture, software capabilities, support terms, and total cost with real workloads. The best choice may be less dramatic, but more maintainable.
Set 2026 Goals with 25/100/400GbE Bandwidth and Port-Density Data
How to Choose Data-Center Network Switches in 2026?
Plan bandwidth around actual traffic, not marketing peaks. A 48-port 25GbE switch provides 1.2Tbps of host-facing capacity. A 32-port 400GbE switch reaches 12.8Tbps before overhead. These figures clarify rack-scale design, but they do not guarantee application performance. The Ethernet Alliance 2024 Ethernet Roadmap identifies 400GbE as a current data-center deployment speed, while 800GbE is entering the next expansion cycle. This supports a practical model: 25GbE for servers, 100GbE for aggregation, and 400GbE for spine links.
Port density needs equal attention. The International Data Corporation 2024 Worldwide Ethernet Switch Tracker reports continuing demand for higher-speed Ethernet in cloud and artificial-intelligence infrastructure. However, higher density increases power draw, cooling pressure, and optical-transceiver costs. Check usable ports, breakout support, buffer size, airflow direction, and telemetry. A 48-port design may look efficient, yet leave fewer ports after uplinks and redundancy.
Numbers can mislead.
In field planning, I would reserve 20% to 30% capacity for growth, failed links, and uneven traffic. That margin is not universal. It should follow measured utilization from interface telemetry, not habit. The Ethernet Alliance data also reminds planners that roadmaps move faster than procurement cycles. A switch selected for 2026 should support software upgrades, 100GbE migration, and 400GbE optics without forcing a complete rack redesign. This is where a slightly less dense platform may prove more reliable.
Match QFX Models to 1/10/25/100/400GbE Interface Requirements
How to Choose QFX Series Network Switches in 2026?
Match the switch to interface demand, not only port count. For 1GbE access, choose compact models with efficient power use and enough PoE capacity. A 10GbE uplink can prevent congestion from wireless controllers, cameras, and storage traffic. For server racks, 25GbE often offers a better balance than 10GbE. It provides higher bandwidth without forcing every component toward 100GbE.
For aggregation, 100GbE becomes practical when several 25GbE racks converge. Check the number of native ports, breakout support, buffer memory, and optics compatibility. The 2024 Ethernet Alliance roadmap places 400GbE in active deployment, while higher speeds remain emerging. That supports 400GbE spine links for dense clusters, but only when traffic patterns justify them. Buying maximum speed too early can waste budget.
There is a catch.
Uptime Institute’s 2024 Global Data Center Survey found that more than half of respondents reported outage costs above $100,000. Therefore, redundancy deserves equal attention. Review dual power supplies, hot-swappable components, telemetry, and tested failover behavior. In real deployments, a 1/10/25GbE mix may outperform a uniform 100GbE design because it matches actual workloads. I would still validate this assumption with seven days of interface-level traffic data. Forecasts are useful, but local traffic is usually less impressive.
Assess Switching Capacity Using Tbps Throughput and Billion-PPS Metrics
How to Choose Juniper QFX Series Network Switches in 2026?
Assess Switching Capacity Using Tbps Throughput and Billion-PPS Metrics
Switching capacity should match real traffic, not just a large headline number. The International Telecommunication Union’s Facts and Figures 2024 report counted 5.5 billion internet users, representing 68% of the global population. This growth increases east-west traffic inside data centers. Therefore, compare total Tbps with port speed, uplink design, and full-duplex performance. A 32-port 100GbE switch can advertise 6.4Tbps, depending on the calculation method. That figure may represent bidirectional capacity. Check the actual forwarding architecture.
Packets per second can expose hidden limits. At 100Gbps, minimum-size Ethernet traffic requires about 148.8 million packets per second. A 32-port 100GbE configuration may therefore demand nearly 4.76 billion PPS. Large packets need fewer PPS, but security, storage, and telemetry traffic can produce mixed packet sizes. The Ethernet Alliance’s 2024 technology roadmap highlights continued movement toward 800GbE and higher-speed links. Future-ready designs need margin, not perfect laboratory conditions. I would reserve at least 20% capacity for bursts, though that buffer may prove too conservative.
Tips: Request both Tbps and billion-PPS figures. Confirm whether values are full-duplex. Ask for results using 64-byte packets, realistic frames, and enabled features. Check latency under load, buffer size, and power per port. A switch can look powerful on paper yet struggle during microbursts. Test it with your traffic profile.
Verify EVPN-VXLAN, BGP, and IEEE 802.1 Standards Compatibility
Choosing a QFX-series switch in 2026 requires more than checking port speed. Verify EVPN-VXLAN, BGP, and IEEE 802.1 standards compatibility first. The Worldwide Ethernet Switch Tracker reported 16.3% year-over-year market growth in Q2 2024, reaching $11.2 billion. Flexera’s 2024 State of the Cloud Report found that 89% of organizations use multiple clouds. Interoperability is no longer optional.
Confirm support for EVPN route types, VXLAN Network Identifiers, anycast gateways, and multihoming. Check whether BGP EVPN operates with your chosen underlay, including eBGP, iBGP, ECMP, and BFD. Review RFC 7432, RFC 7348, and RFC 8365 during design validation. Do not trust a feature checkbox. Ask for release-specific behavior.
IEEE 802.1Q should cover VLAN and bridging requirements. IEEE 802.1AX matters for link aggregation. IEEE 802.1AB supports LLDP discovery, while IEEE 802.1X strengthens edge authentication. Test jumbo-frame MTU across every routed hop. Test convergence during a failed uplink, not only during normal traffic.
Use a small lab.
In deployment reviews, I have seen “compatible” platforms fail because of unsupported route policies or inconsistent VXLAN MTU settings. That is an uncomfortable lesson. Validate scale limits, automation APIs, telemetry, and upgrade procedures with realistic traffic. Record software versions and exact test results. Documentation can be incomplete, and your design might expose the gap.
How to Choose Data-Center Network Switches in 2026?
Verify support for the core technologies used in modern leaf-spine networks. The chart shows the initial publication year of the relevant IETF and IEEE specifications, providing a standards-based checklist for interoperability testing.
Before purchasing, confirm implementation details such as EVPN route types, VXLAN VNI handling, BGP address families, VLAN tagging, link aggregation, and LLDP behavior. Publication years refer to the original specification or standard release.
Compare Power, Latency, Scale, and TCO with Data-Center Benchmarks
Choosing a data-center switch in 2026 requires more than counting ports. Compare power, latency, scale, and five-year TCO together. The IEA’s Electricity 2024 report estimates data centers could use 620–1,050 TWh annually by 2026. A switch drawing 700 watts can therefore become a serious operating cost. Measure watts per active port, not only the maximum chassis rating. Under RFC 2544-style testing, record p99 latency at line rate, including small packets and congestion. A low average can hide damaging tail latency.
Tips:
Build a test sheet with 100G, 400G, and 800G scenarios. Record throughput, packet loss, buffer behavior, optics, airflow, and restart time. Include software subscriptions, maintenance, cabling, and technician hours. The Uptime Institute’s 2024 outage analysis reported that 54% of surveyed organizations experienced a most recent outage costing more than $100,000. Redundant links and predictable failover may justify higher purchase prices.
Scale should match traffic growth, not today’s rack count. Check forwarding-table capacity, EVPN support, telemetry depth, automation interfaces, and upgrade paths. Use public benchmark methods, then repeat tests in your own rack. Results can change with firmware, optics, and temperature. I have seen a clean spreadsheet hide expensive transceivers and weak cooling. That mistake is easy to make. A careful TCO model should show energy, support, migration labor, and probable downtime separately. Do not trust one impressive latency number.